If applications fail consistently and impact negatively the performance of your computer and productivity. You can use the Windows 10 Reliability Monitor to identify the culprit. MiniTool shows you how to use this useful tool.
What Is Reliability Monitor
Usually, Microsoft Windows 10 will hide certain minor problems like random application failures and shutdown errors. When such problems occur, the Windows operating system will automatically troubleshoot a solution and then resolve the problem. Therefore, most of the time, users remain completely unaware that any problem occurred and they can keep a simple life.
Under most circumstances, this approach is reasonable and acceptable for many users. However, if the system or applications fail consistently, or the computer’s performance drops unexplainably, they may want to know what is on earth impacting negatively the performance of their PCs. If so, perhaps it is time to assess just how reliable the PC has been over the past few weeks.
To do that, Reliability Monitor is a necessary tool. What is Reliability Monitor? It is a tool providing an analysis of system stability general situation and trend, as well as detailed information on individual events that may affect overall system stability, such as software installation, operating system updates, and hardware failures.
Once the system is installed, the monitor begins collecting data. The data will help users assess the general performance of their PCs and to discover what applications have been causing systemic problems recently. This post will show you how to use that tool. Just keep reading to get detailed steps.
How to Review Your Computer’s Reliability and Problem History
Step 1: Open Reliability Monitor.
- Type “reliability” in the Windows 10 desktop search box.
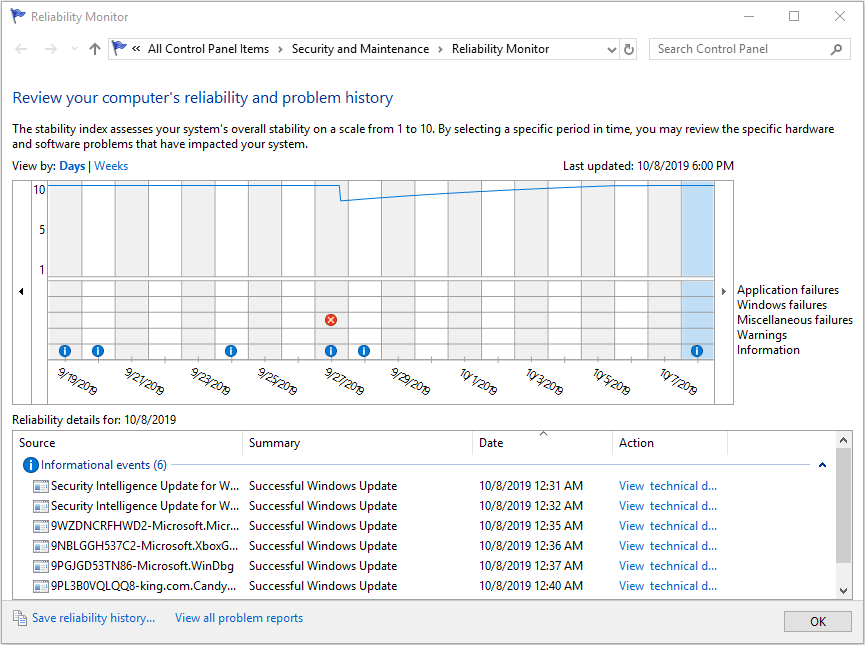
- Click the best-matched item “View reliability history” from the list of results to open Reliability Monitor shown like the following picture.

Step 2: Select the right time period. The Windows 10 reliability monitor graph is actually a timeline of events. It displays events that took place over the past two weeks by default. But the start of the timeline can be moved to an earlier date, if desired.
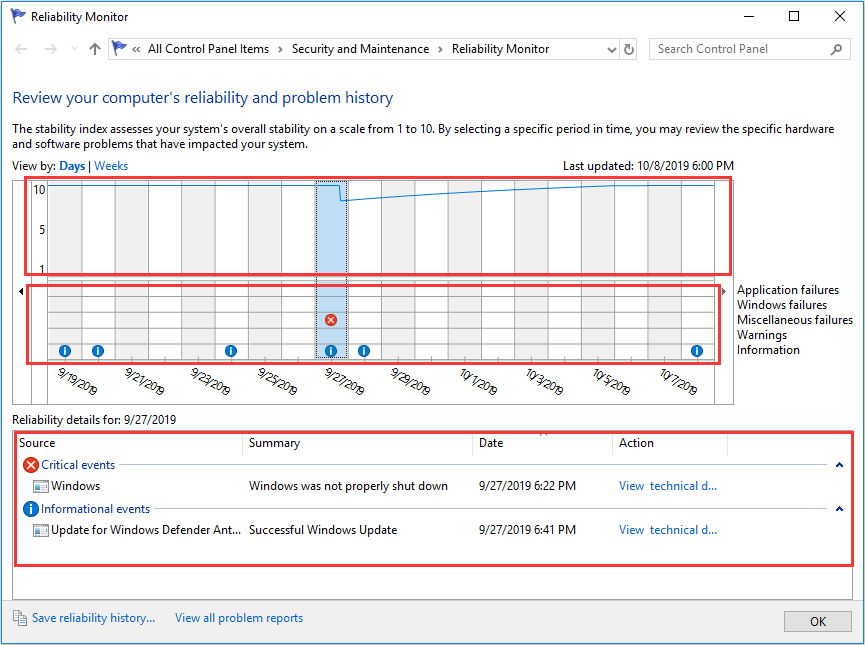
Step 3: Analyze the reliability graph from three distinct areas.
- The line graph in the top area: It displays a composite stability index for your PC on a scale from 1 to 10. The closer the line is to 10, the better. As you can see, my computer drops the index value from about 10 to about 7 on Sept. 7. This is worthy of some investigation.
- The grid section in middle area: It provides more detail about what has caused the stability index to drop each time. The grid places an “X“, an exclamation mark, or other indication in each of the impacted areas to indicate application failures, Windows failures, miscellaneous failures, warnings, and general information.
- The Reliability details in the bottom area: It provides more detailed information about which application failed. The detailed information is displayed usually by clicking on the dates displayed in the grid section.

In my PC, there are many information events about successful Windows update and only one critical event warning on improper Windows shutdown. These updates will certainly not reduce my computer’s performance and the improper Windows shutdown is also not a concern. In a word, my computer runs very well.
In general, Windows 10 reliability monitor will track the pattern of failures to help you assess how stable your PC is during a specific period and discover patterns of behavior that could impact your productivity. If you find a particular application is misbehaving on a regular basis to cause a problem, it may be time to acquire some updated software.

![10 Reasons and 10 Fixes for Computer Running Slow [New Updated]](https://images.minitool.com/partitionwizard.com/images/uploads/2019/08/my-computer-runs-slow-thumbnail.jpg)


User Comments :