Checking the usage of RAM GPU and CPU in Windows is essential for monitoring system performance, diagnosing issues, and optimizing system resources. This post from Partition Magic guides you through various methods to check RAM GPU and CPU usage.
Check RAM GPU and CPU Usage with Task Manager
If you’re using Windows, there are tools built into the operating system that allow you to quickly see how much RAM, CPU, and GPU each process is taking up.
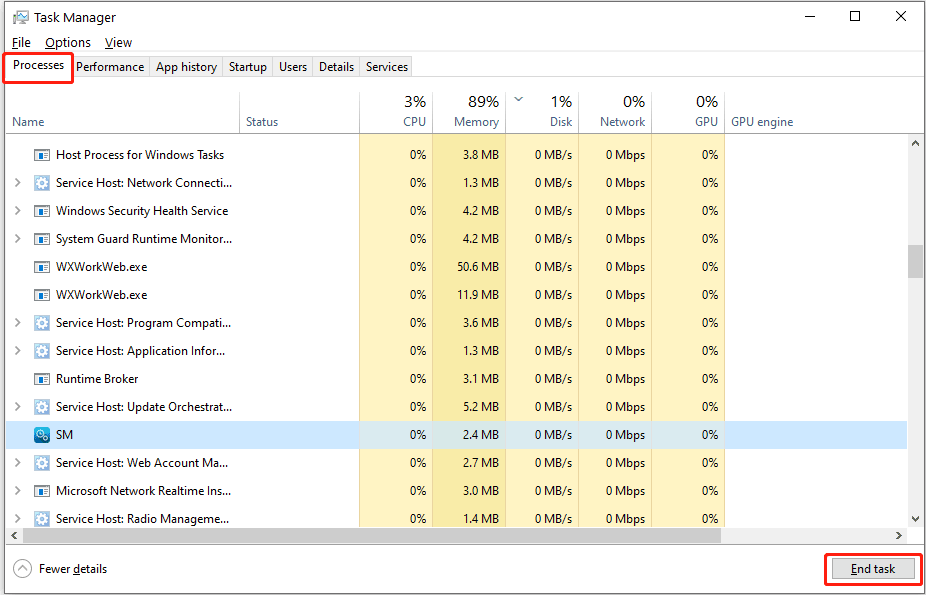
Task Manager is a built-in Windows utility that provides a quick and easy way to monitor RAM GPU and CPU usage. Here’s how to check RAM GPU and CPU usage with Task Manager.
Step 1: Press Ctrl + Shift + Esc to open Task Manager.
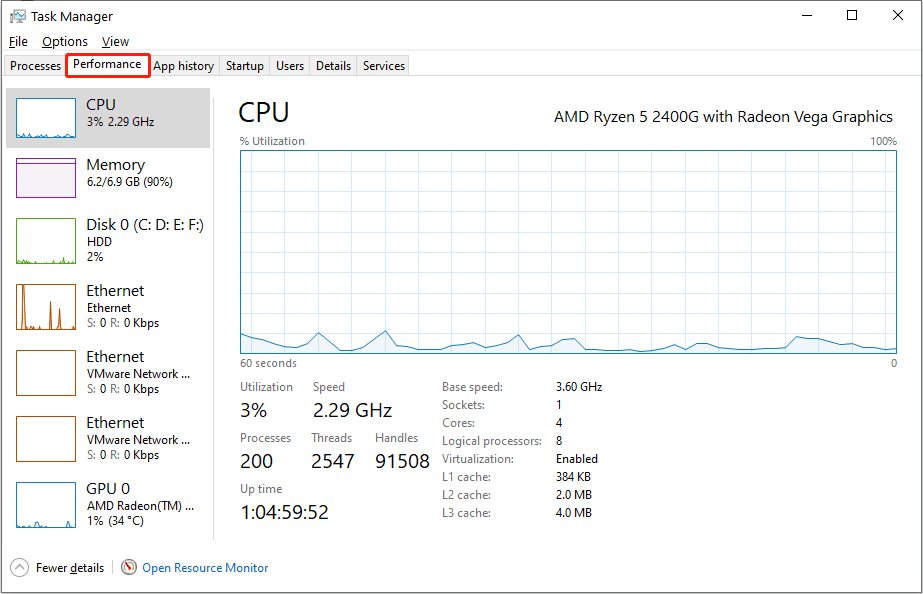
Step 2: Click on the Performance tab. Here, you will see an overview of your system’s performance, including CPU, Memory (RAM), Disk, and Network usage.
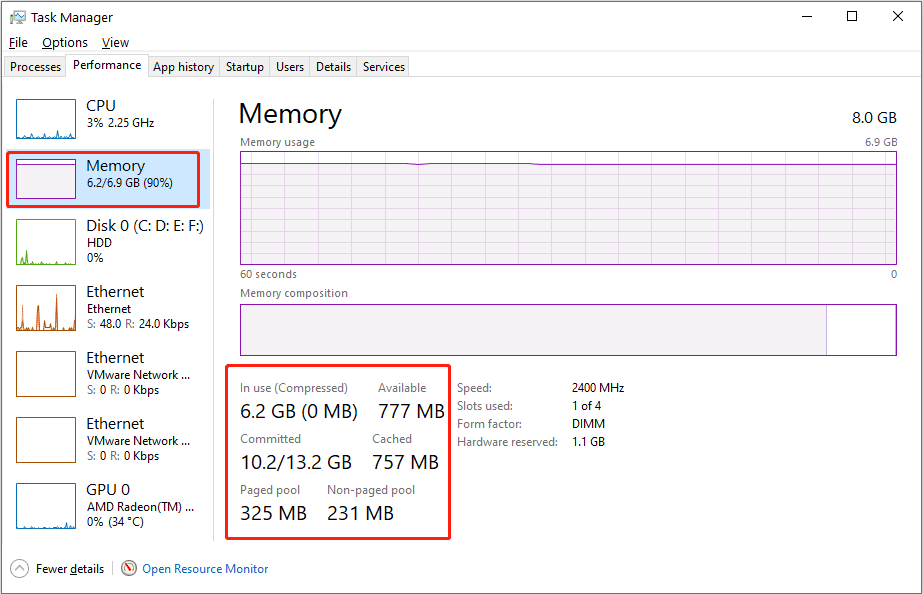
Step 3: Select Memory on the left sidebar to see detailed information about your RAM usage. You can view the total amount of RAM, the amount in use, the amount available, and other metrics like cached, paged pool, and non-paged pool memory.
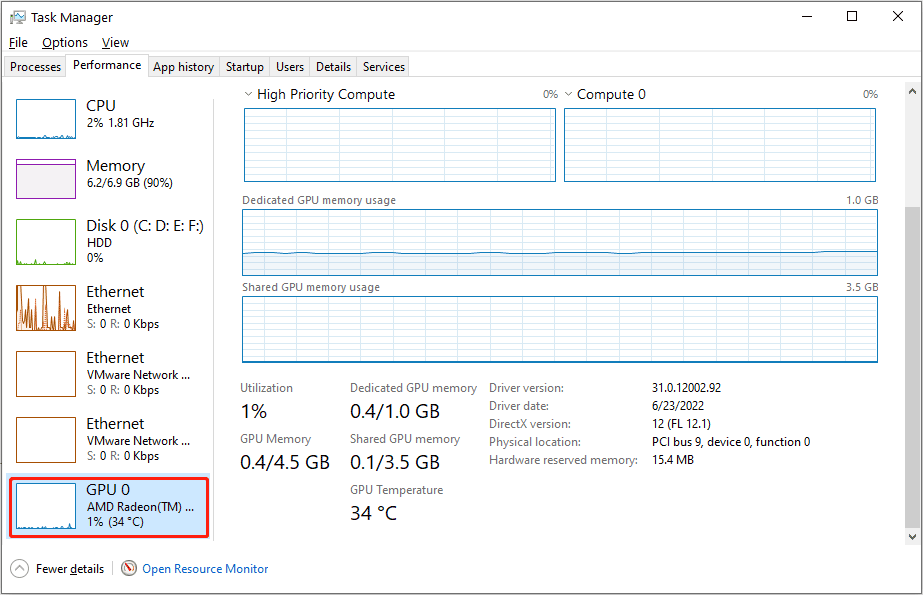
Step 3: Starting with Windows 10 version 1709, Task Manager includes GPU monitoring capabilities. Select GPU on the left sidebar to view GPU usage. This tab provides information about GPU utilization, memory usage, driver version, and other metrics.
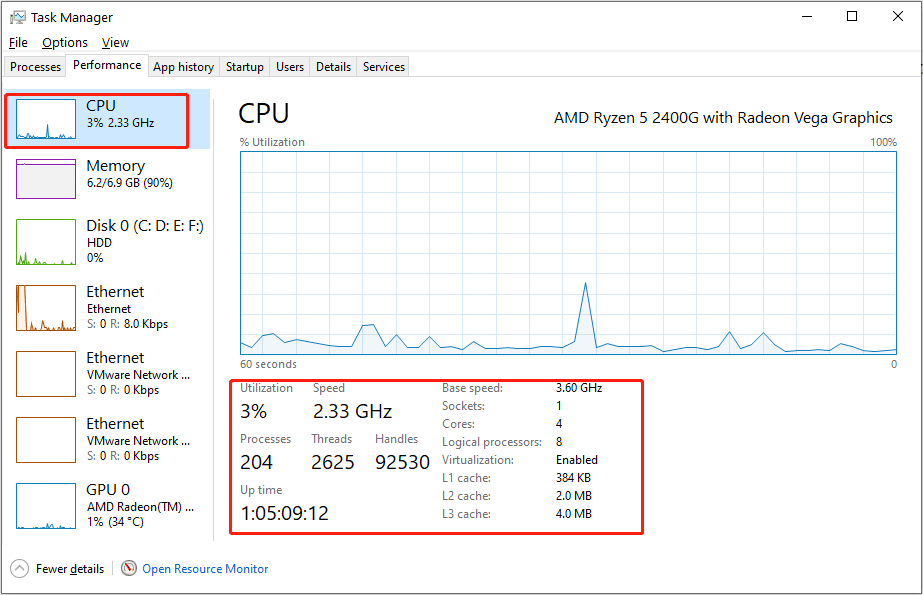
Step 4: Select CPU on the left sidebar. Here, you can see the current CPU utilization, the speed of each core, and other details such as processes using the CPU, up-time, and base speed.
Use Resource Monitor
Resource Monitor is a utility in Windows Vista and later OSes that displays real-time information about the use of hardware (CPU, memory, disk, and network) and software (file handles and modules) resources.
Here’s how you can check RAM, GPU, CPU usage with Resource Monitor.
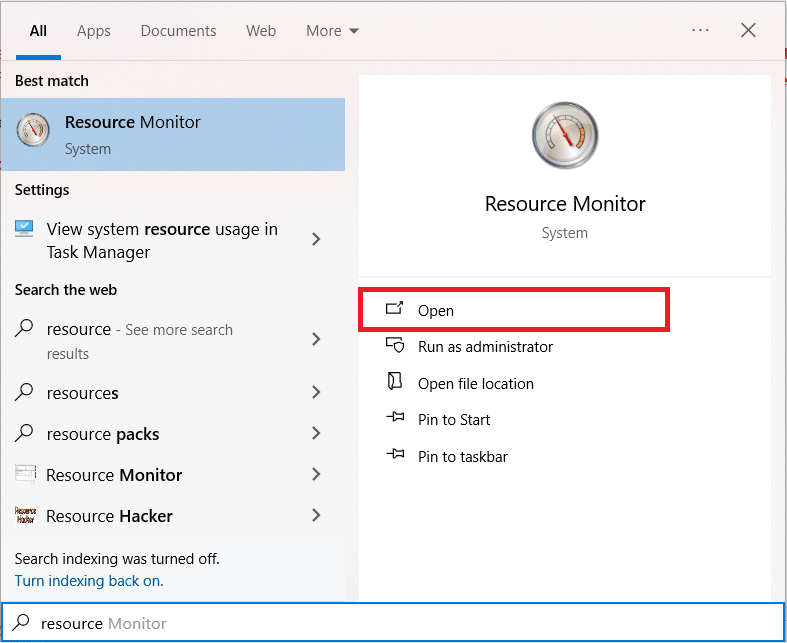
Step 1: Search for Resource Monitor in the search bar, and click Open to launch the tool.
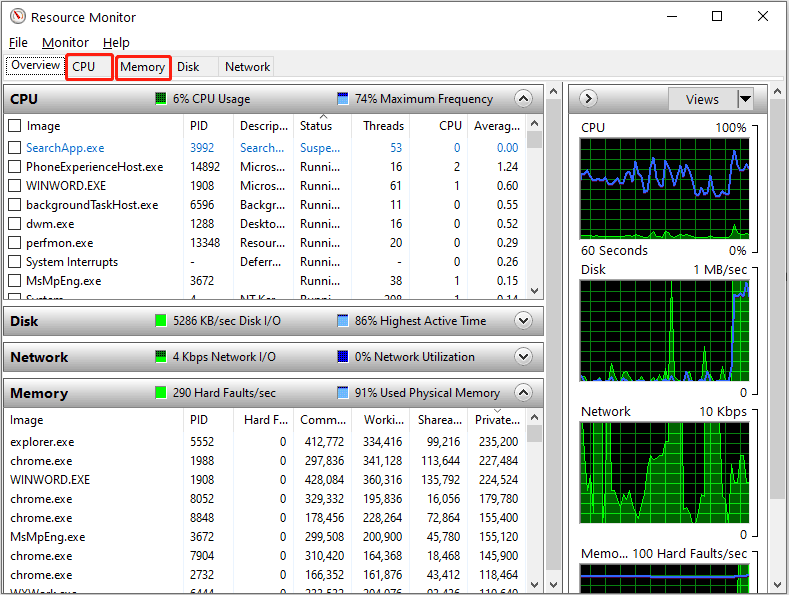
Step 2: In Resource Monitor, go to the Memory tab. Here, you can see a detailed breakdown of how your RAM is being used, including by individual processes. Go to the CPU tab, you will find detailed information about CPU usage, including per-process utilization and overall CPU usage graphs.
Use Performance Monitor
Performance Monitor is a more advanced tool that allows you to create custom monitoring sets and track various performance metrics over time. Here is how you can view performance and system resource details with Performance Monitor.
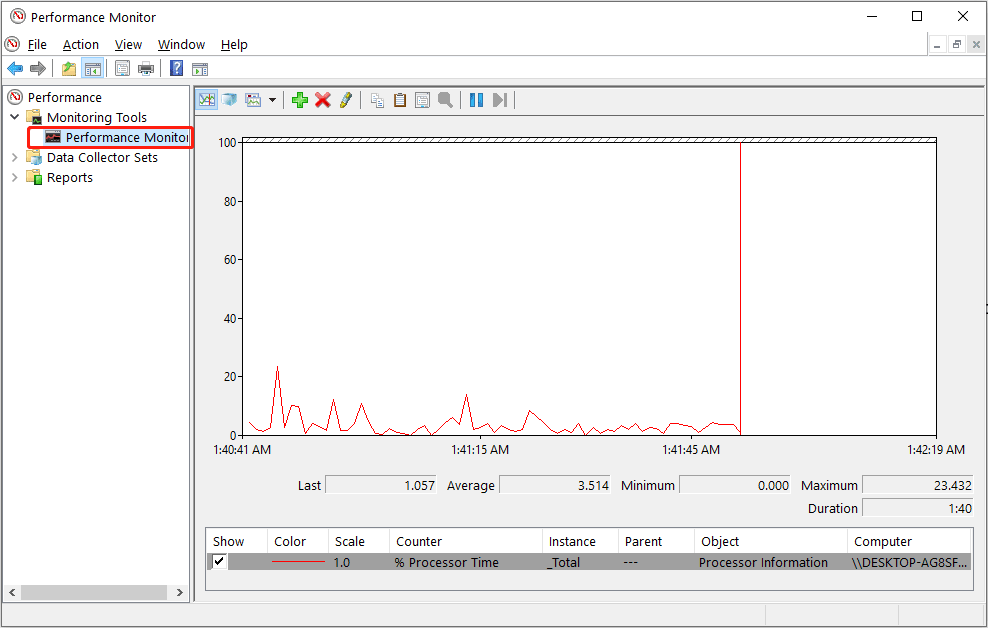
Step 1: Open Performance Monitor by typing Performance Monitor in Windows search bar and pressing Enter. In the left panel, select Performance Monitor to view real-time performance data. By default, the graph shows the processor performance counter.
If the built-in tools in Windows aren’t to your liking, there’s a plethora of third-party tools that you can use to monitor system performance. MiniTool Partition Wizard is a good choice if you want to know more about your drive’s performance, such as testing the speed of your drives by using its Disk Benchmark feature. Here is the guide:
MiniTool Partition Wizard FreeClick to Download100%Clean & Safe
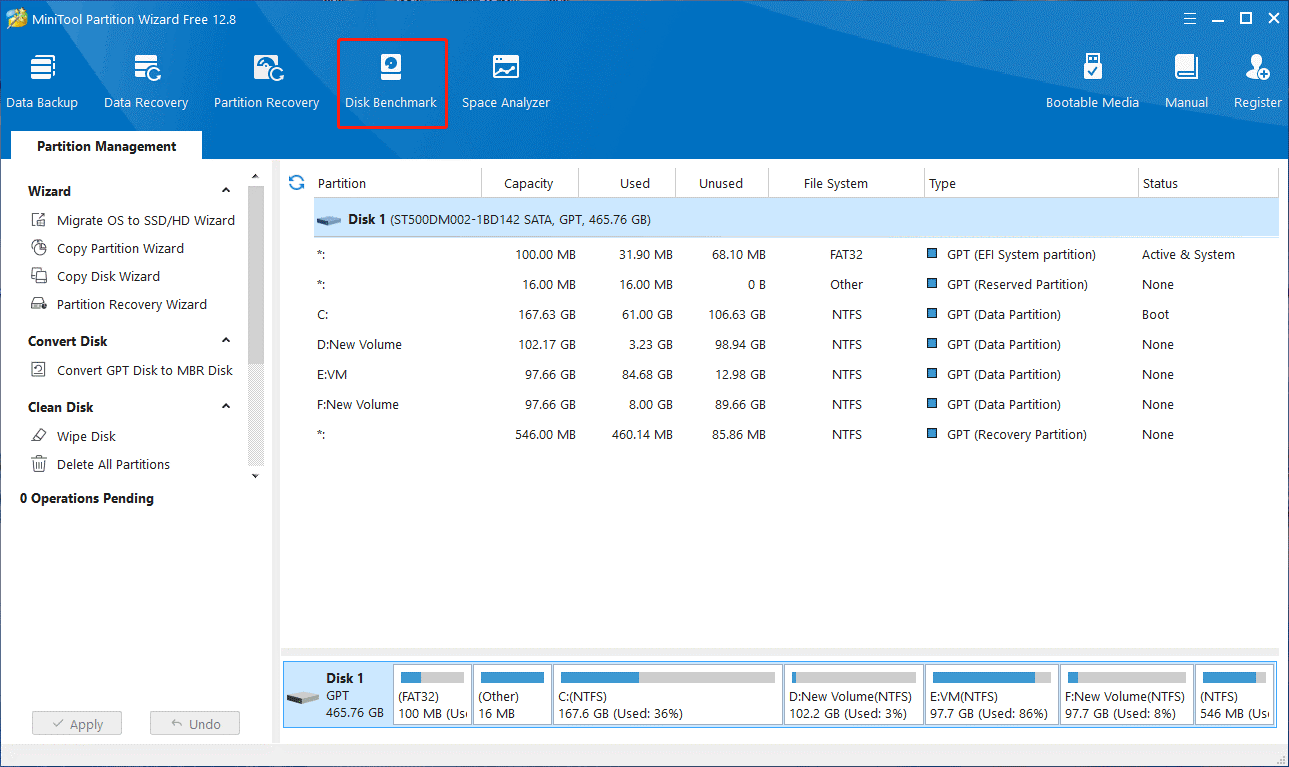
Step 1: Launch MiniTool Partition Wizard and click Disk Benchmark on the tool bar.
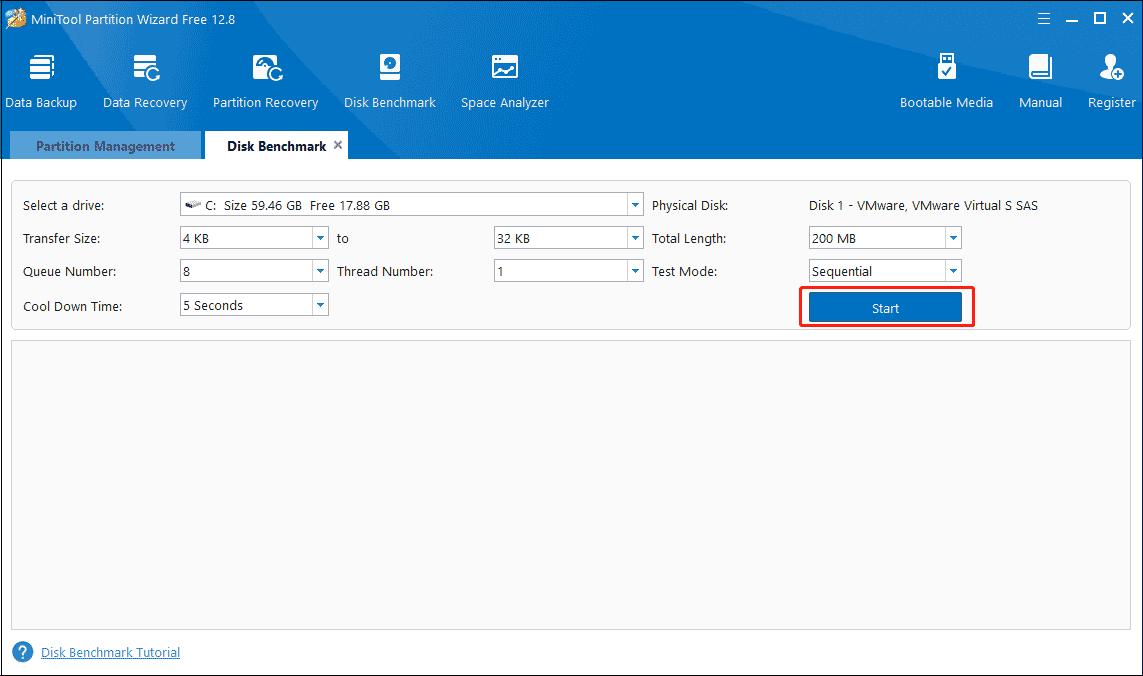
Step 2: Select a partition you want to check, set parameters, and then click Start to test the disk performance.
The parameters are as follows:
- Select a drive: All the drives in this PC are listed here, and users can drop down the list to select a volume to test its performance.
- Transfer Size: The size of the data transferred at one time, ranging from 1KB to 2048KB.
- Total Length: The total amount of data to transfer, ranging from 100MB to 4096MB.
- Queue Number: Queue depth indicates the number of I/O requests being processed in a queue at any given time, ranging from 1 to 512.
- Thread Number: Select how many threads are used to test the speed of the drive. It ranges from 1 to 64.
- Test Mode: There are three modes for users to choose: Sequential, Random, and Sequential & Random.
- Cool Down Time: It is used to reduce the hard drive temperature.
Bottom Line
Monitoring RAM, GPU, and CPU usage in Windows is crucial for maintaining optimal system performance, troubleshooting issues, and ensuring efficient resource management. This post provides a variety of effective and quick ways to help you check your RAM, GPU, CPU usage, and you can try these methods if necessary.
User Comments :